Satisfied customers are foundational to the steady or exponential growth of your business. If you don’t have a proper CS metrics strategy, you are losing customers and repeat business by the minute.
But the question is, how will you retain your loyal customers and repeat purchases if you don’t even know if your customers are satisfied or not?
For that, you first need to know the most important and impactful CS metrics to track and how to measure those customer satisfaction metrics. That’s something you can uncover in this article.
It’s noteworthy that the metrics to measure customer satisfaction are spread throughout the customer journey to gather feedback as a whole. That’s why CS metrics are also known as CX or customer experience metrics.
The customer journey includes short-term interactions and long-term experiences, so you need different CSAT metrics to gauge customers’ pulse at different touchpoints.
Curious to explore? Let’s begin.
What Are Customer Satisfaction Metrics?
Customer satisfaction metrics are numeric scores that gauge customers’ experience with a company. These metrics help businesses find out the gaps in their customer experience and how they can improve it.
The most commonly tracked metrics are:
- Customer Satisfaction Score (CSAT)
- Net Promoter Score (NPS)
- Customer Effort Score (CSAT)
- Customer Service Satisfaction (CSS)
- Customer Health Score (CHS)
- Customer Churn Rate (CCR)
- Abandonment Rate
- First Response Time (FRT)
- First Contact Resolution (FCR)
- Value Enhancement Score (VES)
But why is measuring customer satisfaction metrics significant?
Because customer experience is one of the most prominent components of any business. A report by PwC states that 86% of the customers are likely to spend more for a better customer experience.
So, if customers value CX so much, how can businesses afford to neglect it? That’s where all these CS metrics come into play to save the day.
Why Should You Measure Customer Satisfaction?
Before discussing customer satisfaction measurement metrics, let’s take a little detour to learn why companies need to track them?
Lower Your Churn Rate
Also known as the rate of attrition, it’s the rate at which customers abandon a business entity’s services. The question is, why would customers stop doing business with a company?
A survey by ThinkJar states that as much as 67% of customers churn based on their bad experiences with organizations.
Using customer satisfaction measurement tools, you can identify how many customers have had unpleasant experiences and why. This way, you can find out how high your churn rate is and what factors are causing it.
Once identified, it becomes easy to develop actionable strategies (big or small) to improve CX aspects.
Ace Your Marketing Strategy
It is imperative for every business to have a clear vision of where they should invest their capital for the best results.
For instance you may be tempted to put money on all the available marketing channels at once, but only a few may be driving the right customers to you.
To that end, customer satisfaction survey metrics help you gather data about the marketing channels which are working for you. It is the best way to reallocate the advertising budget strategically.
Case Study: Udemy
A reputable platform like Udemy also went through the same situation to figure out the most active marketing channels for funds reallocation.
Watch this video to learn how customer feedback helped Udemy learn the effectiveness of its advertising spending across different locations.

The learning platform also developed product optimization strategies based on user responses on its customer satisfaction surveys.
Read in detail about how they did it here.
Weapon to Battle Competition
A 2018 Gartner report says that two-thirds of marketers accountable for CX believe they compete based on their company’s CX.
It shows that a seamless customer experience is essential for competing against competitors. Why? Because that is what customers demand.
Previously, customers used to rate companies based on their products and services. But companies can no longer ignore this shift towards experience if they want to stay ahead of the curve..
Word of Mouth Is More Efficient Than Any Campaign
It’s not surprising that 81% of customers trust recommendations from friends and family instead of a brand. That means grand marketing measures with remarkable copies are nothing compared to one bad word of mouth that can quickly turn a dozen more potential customers towards your competitors.
If you continuously track customer satisfaction ratings, you can pinpoint customers’ pain points, resolve them, and create a memorable experience for your users.
A satisfactory experience is all customers need to recommend your products/service and spread positive word of mouth.
Predict Your Business Performance
Customer metrics such as NPS is a great tool to predict revenue from loyal customers and churn from detractors. These metrics offer businesses the foresight to plan strategies accordingly and make provisions for unfortunate events.
For example, if a high-value customer gives you a low rating, say 3, in an NPS survey, you can be proactive by adding a follow-up question asking the reason behind the poor rating.
This way, you can:
- address the reasons for their dissatisfaction,
- turn the bad experience into a happy one,
- prevent churn,
- and tell customers that you care.
What Are the Metrics to Measure Customer Satisfaction?
Before we discuss different customer satisfaction metrics, let’s talk about selecting the right ones. Each CS/CX metric has a definite purpose and usage.
The first step towards choosing the right customer satisfaction metrics is to set a goal.
What do you want to find out with the feedback?
What will you do with the collected data?
The objective should be crystal clear for everything to make sense.
For instance:
- If you may want to know whether your customers are satisfied enough to recommend your brand to others, NPS is your go-to metric.
- If you wish to measure their satisfaction after a specific interaction, you can send CSAT surveys.
With that out of the way, here are 11 customer satisfaction metrics to evaluate customer experience, generate more revenue, and grow your business further.
- Customer Satisfaction Score (CSAT Score)
- Net promoter Score (NPS)
- Customer Effort Score (CES)
- Customer Service Satisfaction (CSS)
- Customer Health Score (CHS)
- Online Ratings/Reviews
- Customer Churn Rate (CCR)
8. Abandonment Rate
What Is Abandonment Rate?
B2C e-commerce businesses face shopping cart abandonment all the time.
The abandonment rate is the percentage of customers who leave the checkout process mid-way without completing the purchase.
Cart abandonment directly impacts your revenue and customer acquisition cost. You just lost a customer at the cusp of conversion.
What Is the Average Cart Abandonment Rate?
The average cart abandonment rate calculated by Baymard Institute is 69.82%.
How Does It Work?
In cart abandonment, customers spend time on your website, selecting products, and adding them to the cart, but something makes them abandon your products altogether.
So, to reduce the abandonment rate, you can directly ask customers about the reason for abandonment using exit-intent pop-ups.
There are many possible reasons for this unfortunate event, such as unoptimized product pages, long checkout process, unclear pricing or shipping policy, etc.
Questions to Ask in Abandonment Survey
- “Was there anything about this checkout process that we should improve?”
- “Is there anything preventing you from completing your purchase?”
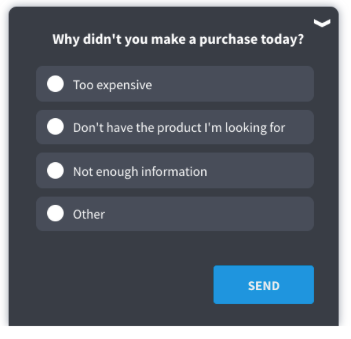
- “Why didn’t you make a purchase today?”
- “What is missing on the page that made you leave without purchasing?”
- “What stopped the user from completing an action?”
- “If you don’t plan to make a purchase, can you tell us why not?”
When to Deploy Exit-Intent Surveys:
You can deploy exit-intent surveys when the customers are about to leave the website. You can trigger popup surveys with Qualaroo as the customers move their cursor closer to the close tab.
This way, you can ask the customers why they did not complete the purchase so you can resolve their issues in real-time and stop them from churning.
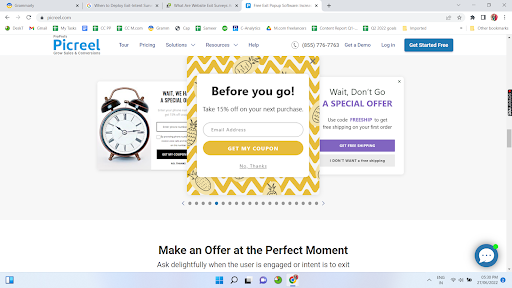
You can even use an exit intent software like Picreel to offer discounts or offers via popups and overlays:
How to Calculate the Abandonment Rate?
Businesses analyze and periodically calculate this customer experience metric to track the impact of abandonment. The higher the rate, the more unsatisfied customers your business has and vice versa.
So, to improve your overall customer experience, you need to lower your abandonment rate.
Here’s how you can calculate it:
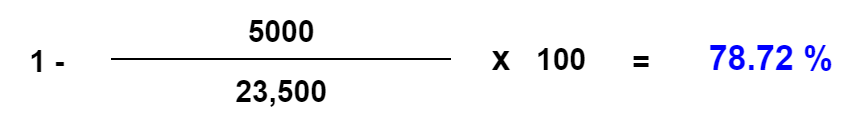
For example, say you made 5,000 sales in a month, and the number of shopping carts created that month was 23,500.
So, according to the formula above, the abandonment rate is 78.72%.
9. First Response Time (FRT)
What Is FRT?
As the name suggests, FRT is the time taken by a company to respond to customers who reach out via different channels such as live chat, email, social media, etc., to get their issues resolved.
But why is this customer satisfaction metric so significant?
Because the more the customers have to wait for a company’s response, the more their experience is hampered.
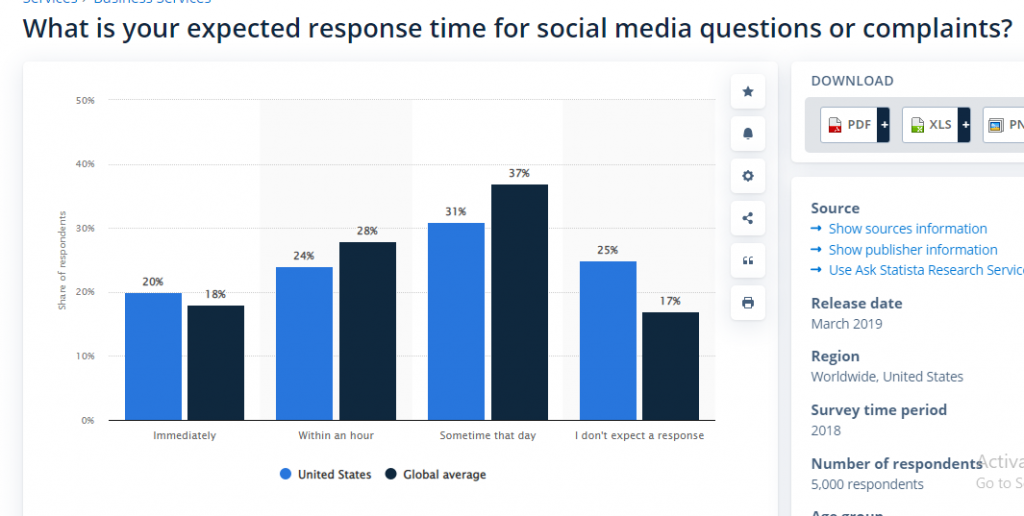
What Is a Good FRT?
First Response Time varies from platform to platform. For example, a good FRT for live chat is 35 seconds or less; for social media, it is anytime on the same day customers reach out; for emails, it is 30 minutes or less.
How Does It Work?
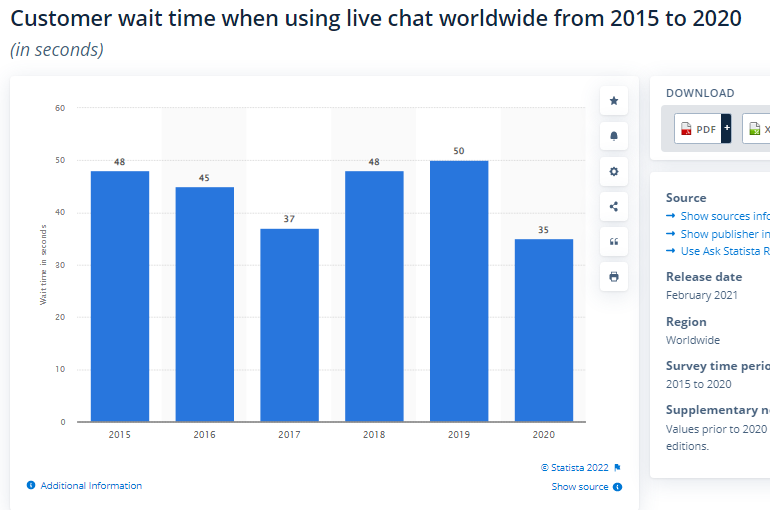
FRT focuses on how fast a customer gets a response from the company regarding their issues or tickets.
As you can see in the graph below, the wait time for customers on live chat hit the ultimate low at 35 seconds in 2020. This gradual decrease in wait time shows how much companies spend on giving the best customer experience with shorter wait times.
How to Calculate FRT?
While calculating First Response Time, companies analyze their interactions across different channels and then compare them to resolved tickets. Here’s the formula:
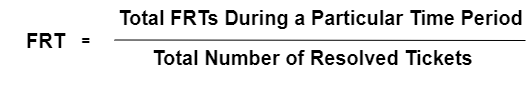
Let’s understand this better with an example.
Suppose you resolved 1000 tickets in June and the time taken for the first response was 25,000 seconds. Then, the average FRT will be:

10. First Contact Resolution (FCR)
What Is FCR?
The First Contact Resolution metric gauges the percentage of service request calls resolved in the first interaction. There is no follow-up or second interaction required.
So, what is the importance of measuring this customer satisfaction metric?
It is a crucial driver of customer satisfaction. The higher the score, the higher the level of satisfaction.
What Is the Average FCR?
According to a study, the average FCR for service desks globally is 74%.
How Does It Work?
You can measure FCR along with other metrics such as Average Handle Time, which gauges the time support agents spend on each call. A fast average talk time and a low FCR indicate low customer satisfaction.
Additionally, a low FCR means more follow-ups and second interactions, which requires more support personnel to take the calls.
Either the customers hang up the call before the agent can provide the resolution, or the team members cannot resolve the queries over the first call (insufficient product knowledge).
Now, there is a simple way to reduce the burden on your support agents. You can leverage a knowledge base software so that customers can resolve small queries on their own.
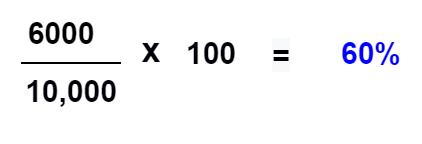
How to Calculate FCR?
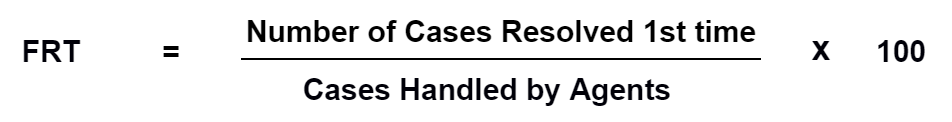
You can use this formula to calculate FCR on calls and tickets issued as well. For example, if you get 10,000 calls and resolve 6,000 in the first interaction. Then your FCR for calls will be:
11. Value Enhancement Score (VES)
What Is VES?
Gartner’s newest customer satisfaction metric, VES, gauges customers’ perceptions and views of products and services. This metric is a great way to boost customer loyalty and retention.
Value Enhancement Score focuses on:
- How the service interaction quality impacts consumers’ ability to use the services/products.
- How the service interaction affects customers’ confidence in the decision to buy products/services.
What Is a Good VES?
Gartner recorded the average VES of 3.96 in their study with 2000 customers.
How Does It Work?
Gartner’s report shows that increased positive feeling of customers toward products/services also increases their perceived value.
As a result, customers are more inclined to purchase again, spread positive word of mouth, and increase their spending limit on a brand’s products/services.
You can use this customer experience metric in different ways as follows:
- Identify the most nurturing and conducive interactions to increase customer loyalty.
- Predict customer behavior based on the interactions.
- Identify your most-skilled support representatives.
- Track individual VES to gauge each customer’s loyalty.
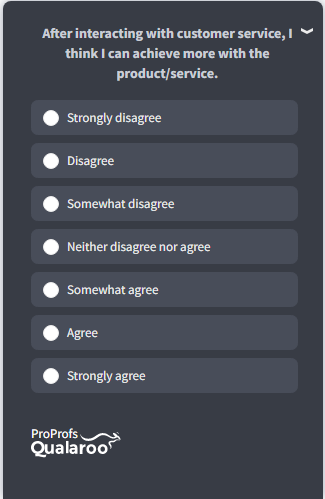
Questions to Ask for VES:
- After interacting with customer service, I think I can achieve more with the product/service.
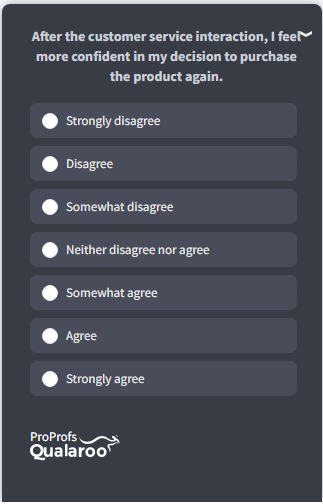
- After the customer service interaction, I feel more confident in my decision to purchase the product again.
When to Deploy VES Surveys:
You can deploy VES surveys after customers interact with your support personnel or use your customer support services like live chat, knowledge base, etc.
How to Calculate VES?
To calculate VES, you need to ask two questions after your customers have made the purchase.
These questions are recorded on a 7-point Likert scale and gauge whether or not the service interaction helped customers achieve more with the product, i.e., whether they perceive the product/service to be more valuable.
The higher the total VES, the higher the value customers place on your products/services.
Choose The Right Tool To Measure Customer Satisfaction
These customer satisfaction metrics play a crucial role in helping businesses get closer to the ground reality of their brand experience and how users feel about their services/products.
To make the efforts count, you can use a robust customer satisfaction metric tool to conduct contextual surveys, collect valuable feedback in view of these metrics, and get the desired results.
That’s where tools like Qualaroo come in handy with multi-channel reach, advanced reporting, and AI-based analytics capabilities.
It enables businesses to efficiently collect and analyze customer satisfaction metrics to know their customers and offer delightful experiences.
Reads
Want insights that improve experience & conversions?
Capture customer feedback to improve customer experience & grow conversions.